The year was 1981. We had a brand new software company as a client—VM Software, and they needed a poster to attract visibility at a trade show. The 80’s were a tumultuous time in the technology space. Mainframes were king, and it would be the mid to late part of the decade before we would even own a Macintosh which we leased along with a 10″ (maybe 12″) monitor, keyboard and mouse, for the princely sum of $15,000.
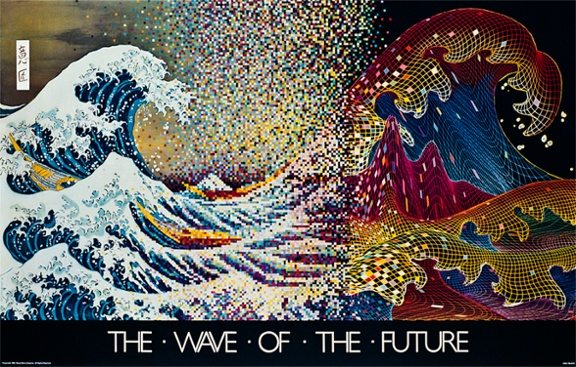
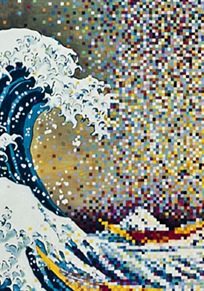
Along with my former partner, Alex Berry, we conceived a poster that would take the famous Hokusai wave and morph it into a new format—representing the transition from analog to digital and is reflective of where the software/hardware industry was starting to move. Mainframe technology and legacy systems were on their way out, and a new order was in its infancy. The internet was still just an experiment and would not be available to the public for many years to come.
Bits and bytes were just starting to be seen and I had this idea of morphing an image from an oil painting to a digitized version to line work. I had recently graduated from the Harvard Graduate School of Design in 1977 and was fascinated with the research being done there by Eric Teicholz and the Harvard Laboratory for Computer and Spatial Graphics. They were located one floor above my studio space and I remembered seeing a very different kind of map. I remembered being fascinated by the line work on the maps and intrigued that they were generated by mapping data sets using a computer—not by hand. These maps gave birth to an idea for a poster for our new client, VM Software.
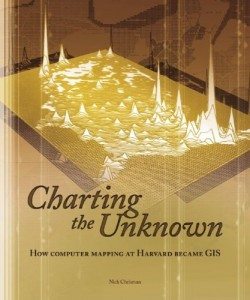
Unfortunately, mapping of this kind was prohibitively expensive and out of our reach. I contacted the Harvard Lab and remembered talking to Eric, but it soon became clear that if I wanted a digitized image, or a bit mapped one, I was going to have to create it myself—and in 1981—that meant creating it by hand.
![]()
Getting an image of the Hokusai wave was easy. I then contacted an illustrator that I had worked with and asked him if he would be able to create a digitized section of the map. Brad Pomeroy labored on creating hundreds of tiny little squares by overlaying an acetate sheet over a copy of the original lithograph and coloring each and every one by hand using Prismacolor pencils. While Brad was working on the digital version, we tried to figure out how to attack the line work. While this might be easy today using Illustrator or Photoshop—back then those programs did not exist. Instead, I had two designers laboriously ink each line on another vellum overlap using rapidographs and ink. Since the line work had to be precise, each artist could only work on it for 1/2 hour at a time—so three of us spent untold hours switching off.
Then we had to figure out a way to blend the digitized portion with the original and the line work to the digitized portion. That involved two more overlays and yet another one for where the black would appear. With a total of six overlays—there was really no way to be certain how the final piece would turn out. I handled all of the transitions, hand coloring odd shapes, carefully adding squares that would blend into the line work and supervising the colors that would peak out from the line work. Then we had to turn the entire set over to the printer, Virginia Lithograph, and trust that it would work out on press.
As a young designer, I was nervous that my brainchild poster would flop and untold hours of time and expense would not be successful. Plus, I had a client that was growing impatient and needed this poster for the upcoming tradeshow. I remember the butterflies in my stomach as I watched the poster emerge on press—I was terrified and almost could not look at it. Luckily, the owner of Virgina Lithograph, master printer Roger Chavez took over and made sure everything went well.
The poster was a huge success for VM Software—and was reprinted many times. It went into commercial printing in 1983 and was actually part of a divorce settlement between my former partner and his third wife. After that, I lost track of how many times it was reprinted. I have seen the poster on TV, in movies, and I even have a jigsaw puzzle that was made from the poster. I still get requests for copies of the poster and people often want to know what program I used to create it and what filters I used. I get a chuckle out of that thinking that this poster really did portend the wave of the future. Oh, and one last hidden clue that I have never revealed—the Japanese calligraphy in the top left hand corner—it means “Grafik.”